pi018
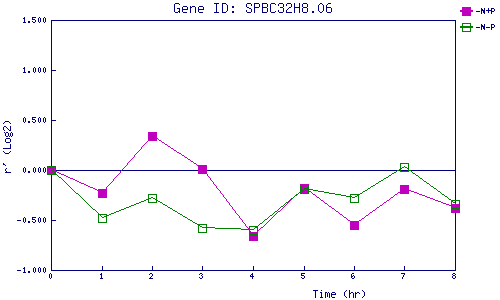
| 0 | 1 | 2 | 3 | 4 | 5 | 6 | 7 | 8 | |
| -N+P | 0.000 | -0.231 | 0.343 | 0.007 | -0.655 | -0.177 | -0.550 | -0.192 | -0.383 |
| -N-P | 0.000 | -0.478 | -0.279 | -0.583 | -0.601 | -0.187 | -0.280 | 0.030 | -0.339 |
|
-N+P: Nitrogen starved in the presence of P-factor -N-P: Nitrogen starved in the absence of P-factor |