pi016
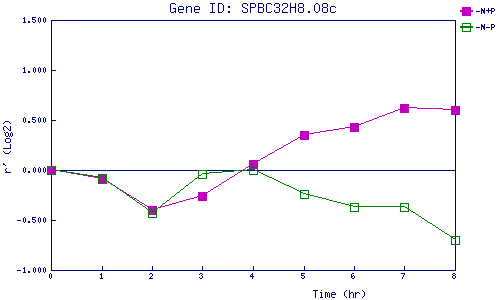
| 0 | 1 | 2 | 3 | 4 | 5 | 6 | 7 | 8 | |
| -N+P | 0.000 | -0.088 | -0.396 | -0.260 | 0.059 | 0.352 | 0.434 | 0.625 | 0.605 |
| -N-P | 0.000 | -0.076 | -0.433 | -0.041 | 0.003 | -0.244 | -0.373 | -0.367 | -0.702 |
|
-N+P: Nitrogen starved in the presence of P-factor -N-P: Nitrogen starved in the absence of P-factor |