fdh fdh1
| 0 | 1 | 2 | 3 | 4 | 5 | 6 | 7 | 8 | |
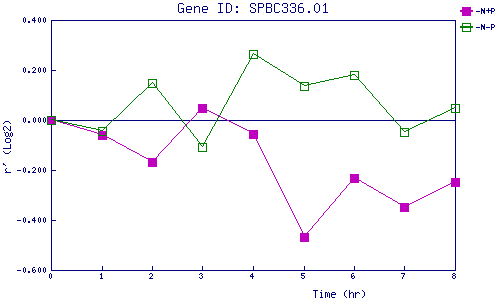
| -N+P | 0.000 | -0.059 | -0.167 | 0.046 | -0.054 | -0.469 | -0.233 | -0.347 | -0.248 |
| -N-P | 0.000 | -0.043 | 0.149 | -0.107 | 0.262 | 0.134 | 0.180 | -0.047 | 0.048 |
|
-N+P: Nitrogen starved in the presence of P-factor -N-P: Nitrogen starved in the absence of P-factor |
