dim1
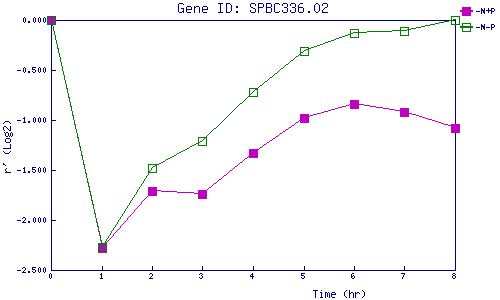
| 0 | 1 | 2 | 3 | 4 | 5 | 6 | 7 | 8 | |
| -N+P | 0.000 | -2.284 | -1.709 | -1.744 | -1.329 | -0.981 | -0.841 | -0.924 | -1.078 |
| -N-P | 0.000 | -2.271 | -1.480 | -1.211 | -0.721 | -0.307 | -0.128 | -0.114 | -0.001 |
|
-N+P: Nitrogen starved in the presence of P-factor -N-P: Nitrogen starved in the absence of P-factor |