pol3 pold cdc6 mis10
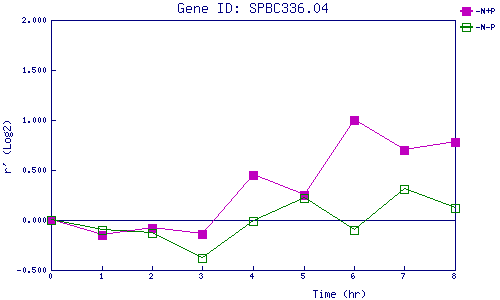
| 0 | 1 | 2 | 3 | 4 | 5 | 6 | 7 | 8 | |
| -N+P | 0.000 | -0.147 | -0.078 | -0.135 | 0.454 | 0.251 | 0.998 | 0.704 | 0.781 |
| -N-P | 0.000 | -0.095 | -0.133 | -0.379 | -0.013 | 0.224 | -0.098 | 0.311 | 0.122 |
|
-N+P: Nitrogen starved in the presence of P-factor -N-P: Nitrogen starved in the absence of P-factor |