rnh1
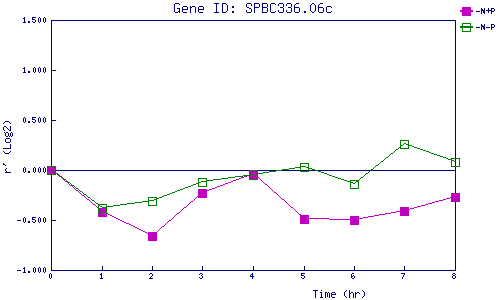
| 0 | 1 | 2 | 3 | 4 | 5 | 6 | 7 | 8 | |
| -N+P | 0.000 | -0.424 | -0.660 | -0.234 | -0.044 | -0.490 | -0.501 | -0.408 | -0.268 |
| -N-P | 0.000 | -0.380 | -0.307 | -0.118 | -0.047 | 0.029 | -0.138 | 0.261 | 0.080 |
|
-N+P: Nitrogen starved in the presence of P-factor -N-P: Nitrogen starved in the absence of P-factor |