rrn7
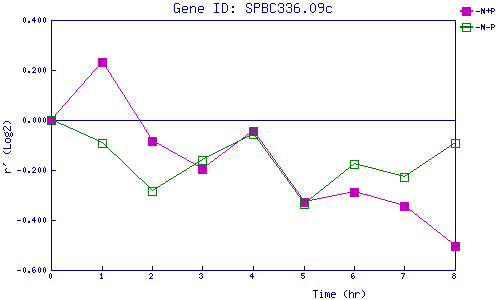
| 0 | 1 | 2 | 3 | 4 | 5 | 6 | 7 | 8 | |
| -N+P | 0.000 | 0.230 | -0.085 | -0.196 | -0.043 | -0.328 | -0.286 | -0.345 | -0.504 |
| -N-P | 0.000 | -0.092 | -0.285 | -0.159 | -0.056 | -0.338 | -0.174 | -0.227 | -0.091 |
|
-N+P: Nitrogen starved in the presence of P-factor -N-P: Nitrogen starved in the absence of P-factor |