tif512
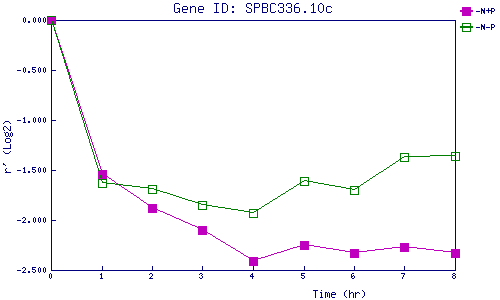
| 0 | 1 | 2 | 3 | 4 | 5 | 6 | 7 | 8 | |
| -N+P | 0.000 | -1.541 | -1.875 | -2.097 | -2.412 | -2.247 | -2.331 | -2.267 | -2.331 |
| -N-P | 0.000 | -1.627 | -1.686 | -1.852 | -1.931 | -1.610 | -1.703 | -1.369 | -1.364 |
|
-N+P: Nitrogen starved in the presence of P-factor -N-P: Nitrogen starved in the absence of P-factor |