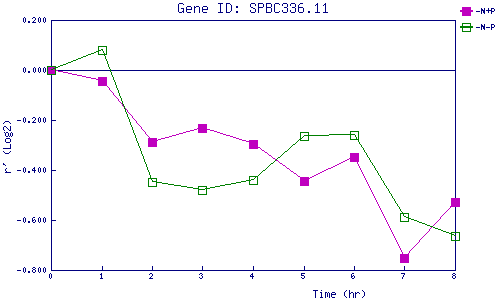
| 0 | 1 | 2 | 3 | 4 | 5 | 6 | 7 | 8 | |
| -N+P | 0.000 | -0.044 | -0.290 | -0.233 | -0.294 | -0.444 | -0.349 | -0.750 | -0.527 |
| -N-P | 0.000 | 0.081 | -0.449 | -0.478 | -0.438 | -0.262 | -0.260 | -0.589 | -0.663 |
|
-N+P: Nitrogen starved in the presence of P-factor -N-P: Nitrogen starved in the absence of P-factor |