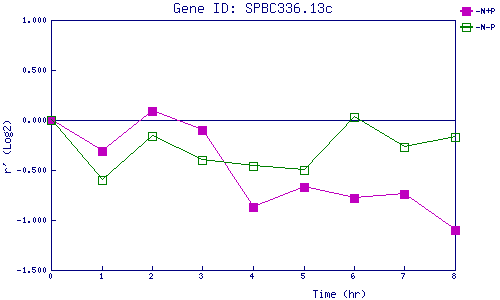
| 0 | 1 | 2 | 3 | 4 | 5 | 6 | 7 | 8 | |
| -N+P | 0.000 | -0.311 | 0.093 | -0.101 | -0.866 | -0.671 | -0.778 | -0.739 | -1.095 |
| -N-P | 0.000 | -0.597 | -0.163 | -0.397 | -0.461 | -0.498 | 0.029 | -0.273 | -0.171 |
|
-N+P: Nitrogen starved in the presence of P-factor -N-P: Nitrogen starved in the absence of P-factor |