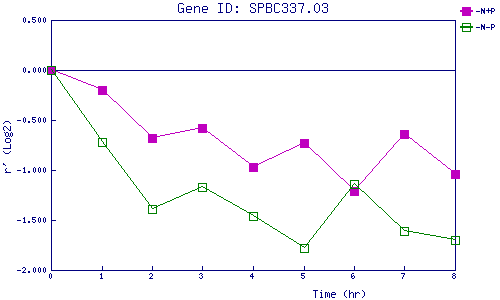
| 0 | 1 | 2 | 3 | 4 | 5 | 6 | 7 | 8 | |
| -N+P | 0.000 | -0.195 | -0.675 | -0.583 | -0.972 | -0.732 | -1.209 | -0.642 | -1.041 |
| -N-P | 0.000 | -0.725 | -1.391 | -1.169 | -1.460 | -1.781 | -1.139 | -1.609 | -1.704 |
|
-N+P: Nitrogen starved in the presence of P-factor -N-P: Nitrogen starved in the absence of P-factor |