cct8
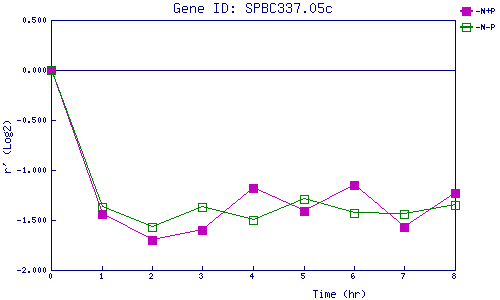
| 0 | 1 | 2 | 3 | 4 | 5 | 6 | 7 | 8 | |
| -N+P | 0.000 | -1.443 | -1.700 | -1.595 | -1.179 | -1.412 | -1.149 | -1.570 | -1.232 |
| -N-P | 0.000 | -1.369 | -1.571 | -1.366 | -1.499 | -1.293 | -1.432 | -1.441 | -1.352 |
|
-N+P: Nitrogen starved in the presence of P-factor -N-P: Nitrogen starved in the absence of P-factor |