erg28
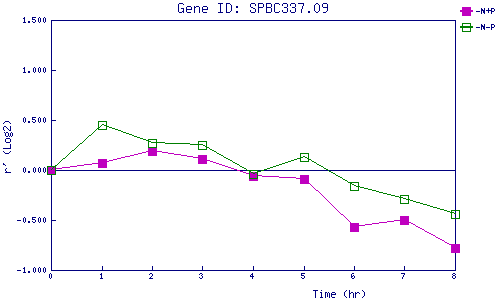
| 0 | 1 | 2 | 3 | 4 | 5 | 6 | 7 | 8 | |
| -N+P | 0.000 | 0.074 | 0.189 | 0.114 | -0.055 | -0.092 | -0.572 | -0.502 | -0.780 |
| -N-P | 0.000 | 0.446 | 0.273 | 0.247 | -0.044 | 0.127 | -0.164 | -0.292 | -0.436 |
|
-N+P: Nitrogen starved in the presence of P-factor -N-P: Nitrogen starved in the absence of P-factor |