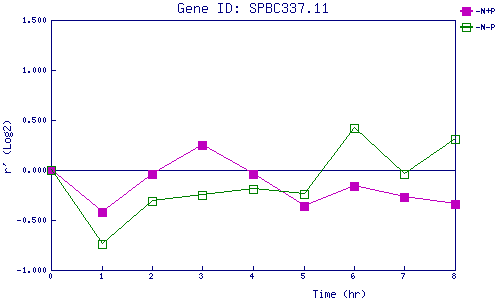
| 0 | 1 | 2 | 3 | 4 | 5 | 6 | 7 | 8 | |
| -N+P | 0.000 | -0.422 | -0.041 | 0.246 | -0.043 | -0.360 | -0.160 | -0.270 | -0.341 |
| -N-P | 0.000 | -0.743 | -0.307 | -0.250 | -0.188 | -0.236 | 0.419 | -0.041 | 0.306 |
|
-N+P: Nitrogen starved in the presence of P-factor -N-P: Nitrogen starved in the absence of P-factor |