rpb4
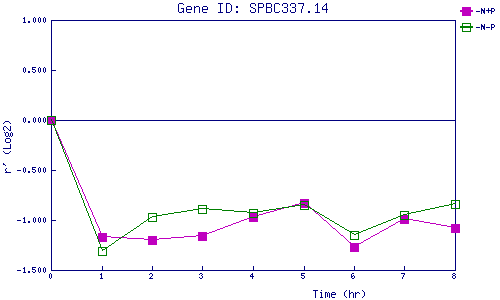
| 0 | 1 | 2 | 3 | 4 | 5 | 6 | 7 | 8 | |
| -N+P | 0.000 | -1.169 | -1.196 | -1.158 | -0.970 | -0.826 | -1.270 | -0.986 | -1.082 |
| -N-P | 0.000 | -1.314 | -0.971 | -0.887 | -0.928 | -0.849 | -1.148 | -0.950 | -0.835 |
|
-N+P: Nitrogen starved in the presence of P-factor -N-P: Nitrogen starved in the absence of P-factor |