rhp9 crb2
| 0 | 1 | 2 | 3 | 4 | 5 | 6 | 7 | 8 | |
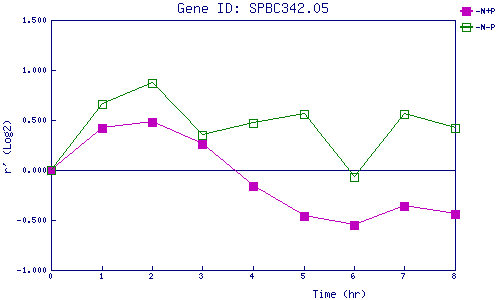
| -N+P | 0.000 | 0.415 | 0.484 | 0.257 | -0.159 | -0.456 | -0.549 | -0.356 | -0.437 |
| -N-P | 0.000 | 0.662 | 0.870 | 0.347 | 0.471 | 0.560 | -0.071 | 0.561 | 0.420 |
|
-N+P: Nitrogen starved in the presence of P-factor -N-P: Nitrogen starved in the absence of P-factor |