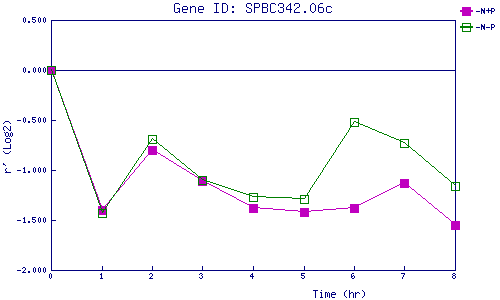
| 0 | 1 | 2 | 3 | 4 | 5 | 6 | 7 | 8 | |
| -N+P | 0.000 | -1.397 | -0.800 | -1.111 | -1.375 | -1.422 | -1.384 | -1.134 | -1.550 |
| -N-P | 0.000 | -1.434 | -0.692 | -1.097 | -1.268 | -1.288 | -0.521 | -0.733 | -1.160 |
|
-N+P: Nitrogen starved in the presence of P-factor -N-P: Nitrogen starved in the absence of P-factor |