gtp1
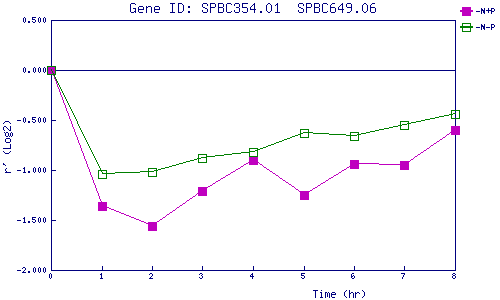
| 0 | 1 | 2 | 3 | 4 | 5 | 6 | 7 | 8 | |
| -N+P | 0.000 | -1.357 | -1.559 | -1.211 | -0.903 | -1.251 | -0.940 | -0.950 | -0.596 |
| -N-P | 0.000 | -1.044 | -1.021 | -0.878 | -0.815 | -0.633 | -0.663 | -0.549 | -0.443 |
|
-N+P: Nitrogen starved in the presence of P-factor -N-P: Nitrogen starved in the absence of P-factor |