sec61
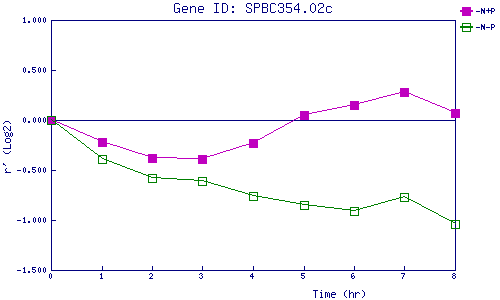
| 0 | 1 | 2 | 3 | 4 | 5 | 6 | 7 | 8 | |
| -N+P | 0.000 | -0.217 | -0.376 | -0.393 | -0.230 | 0.050 | 0.150 | 0.277 | 0.074 |
| -N-P | 0.000 | -0.390 | -0.578 | -0.609 | -0.764 | -0.850 | -0.910 | -0.774 | -1.044 |
|
-N+P: Nitrogen starved in the presence of P-factor -N-P: Nitrogen starved in the absence of P-factor |