swd3
| 0 | 1 | 2 | 3 | 4 | 5 | 6 | 7 | 8 | |
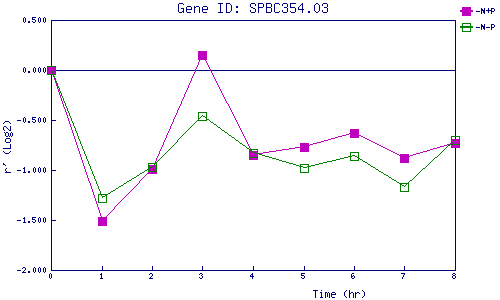
| -N+P | 0.000 | -1.511 | -0.993 | 0.154 | -0.847 | -0.767 | -0.629 | -0.878 | -0.730 |
| -N-P | 0.000 | -1.281 | -0.970 | -0.465 | -0.829 | -0.982 | -0.861 | -1.168 | -0.696 |
|
-N+P: Nitrogen starved in the presence of P-factor -N-P: Nitrogen starved in the absence of P-factor |
