| 0 | 1 | 2 | 3 | 4 | 5 | 6 | 7 | 8 | |
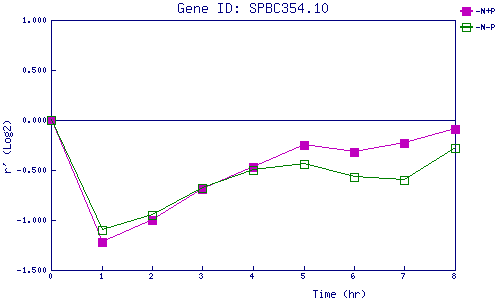
| -N+P | 0.000 | -1.218 | -0.998 | -0.687 | -0.468 | -0.247 | -0.323 | -0.232 | -0.086 |
| -N-P | 0.000 | -1.096 | -0.954 | -0.680 | -0.501 | -0.436 | -0.574 | -0.602 | -0.285 |
|
-N+P: Nitrogen starved in the presence of P-factor -N-P: Nitrogen starved in the absence of P-factor |
