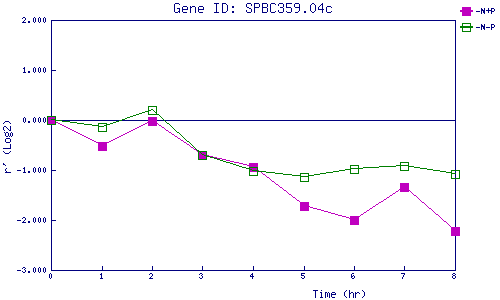
| 0 | 1 | 2 | 3 | 4 | 5 | 6 | 7 | 8 | |
| -N+P | 0.000 | -0.527 | -0.015 | -0.704 | -0.946 | -1.712 | -2.004 | -1.335 | -2.225 |
| -N-P | 0.000 | -0.143 | 0.209 | -0.702 | -1.018 | -1.142 | -0.975 | -0.921 | -1.079 |
|
-N+P: Nitrogen starved in the presence of P-factor -N-P: Nitrogen starved in the absence of P-factor |