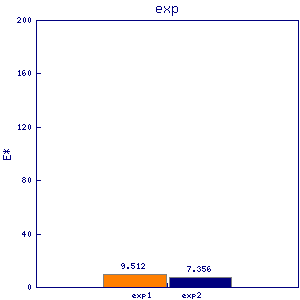
clr6
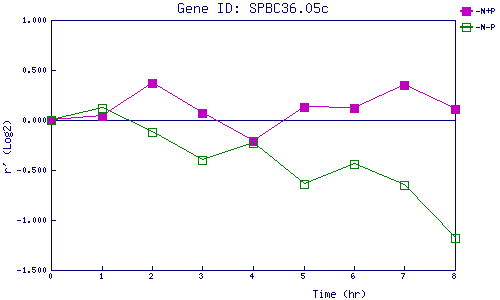
| 0 | 1 | 2 | 3 | 4 | 5 | 6 | 7 | 8 | |
| -N+P | 0.000 | 0.039 | 0.374 | 0.068 | -0.206 | 0.133 | 0.124 | 0.350 | 0.111 |
| -N-P | 0.000 | 0.121 | -0.122 | -0.405 | -0.231 | -0.644 | -0.444 | -0.652 | -1.179 |
|
-N+P: Nitrogen starved in the presence of P-factor -N-P: Nitrogen starved in the absence of P-factor |