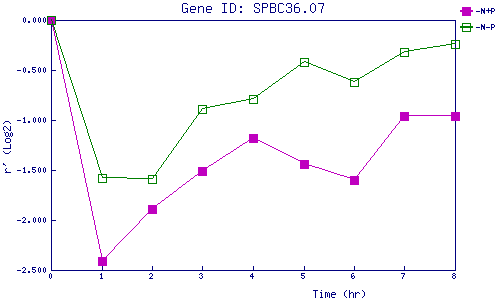
| 0 | 1 | 2 | 3 | 4 | 5 | 6 | 7 | 8 | |
| -N+P | 0.000 | -2.412 | -1.892 | -1.512 | -1.183 | -1.444 | -1.598 | -0.955 | -0.964 |
| -N-P | 0.000 | -1.583 | -1.587 | -0.891 | -0.794 | -0.417 | -0.622 | -0.318 | -0.237 |
|
-N+P: Nitrogen starved in the presence of P-factor -N-P: Nitrogen starved in the absence of P-factor |
