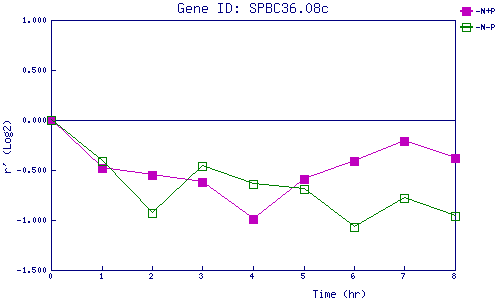
| 0 | 1 | 2 | 3 | 4 | 5 | 6 | 7 | 8 | |
| -N+P | 0.000 | -0.475 | -0.546 | -0.617 | -0.988 | -0.587 | -0.408 | -0.212 | -0.381 |
| -N-P | 0.000 | -0.409 | -0.928 | -0.464 | -0.638 | -0.690 | -1.068 | -0.779 | -0.962 |
|
-N+P: Nitrogen starved in the presence of P-factor -N-P: Nitrogen starved in the absence of P-factor |