sap61
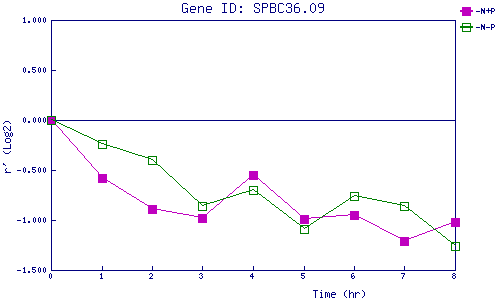
| 0 | 1 | 2 | 3 | 4 | 5 | 6 | 7 | 8 | |
| -N+P | 0.000 | -0.575 | -0.894 | -0.982 | -0.546 | -0.993 | -0.954 | -1.206 | -1.024 |
| -N-P | 0.000 | -0.237 | -0.402 | -0.865 | -0.705 | -1.089 | -0.760 | -0.856 | -1.265 |
|
-N+P: Nitrogen starved in the presence of P-factor -N-P: Nitrogen starved in the absence of P-factor |