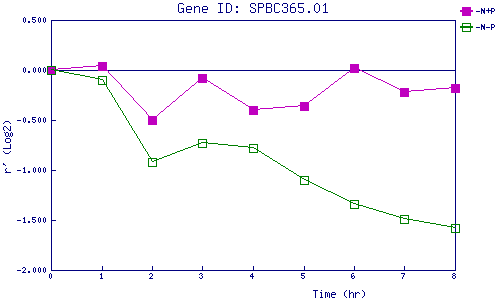
| 0 | 1 | 2 | 3 | 4 | 5 | 6 | 7 | 8 | |
| -N+P | 0.000 | 0.036 | -0.497 | -0.083 | -0.402 | -0.360 | 0.022 | -0.215 | -0.177 |
| -N-P | 0.000 | -0.098 | -0.918 | -0.730 | -0.777 | -1.099 | -1.342 | -1.487 | -1.576 |
|
-N+P: Nitrogen starved in the presence of P-factor -N-P: Nitrogen starved in the absence of P-factor |