rpl21 rpl2101
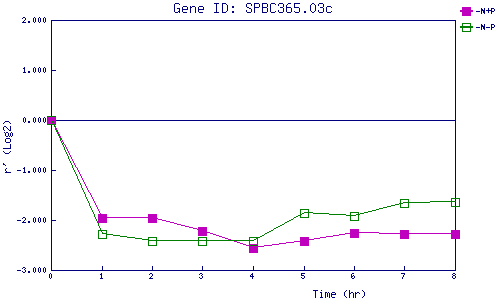
| 0 | 1 | 2 | 3 | 4 | 5 | 6 | 7 | 8 | |
| -N+P | 0.000 | -1.970 | -1.955 | -2.213 | -2.566 | -2.419 | -2.261 | -2.277 | -2.290 |
| -N-P | 0.000 | -2.277 | -2.423 | -2.412 | -2.411 | -1.858 | -1.929 | -1.658 | -1.644 |
|
-N+P: Nitrogen starved in the presence of P-factor -N-P: Nitrogen starved in the absence of P-factor |