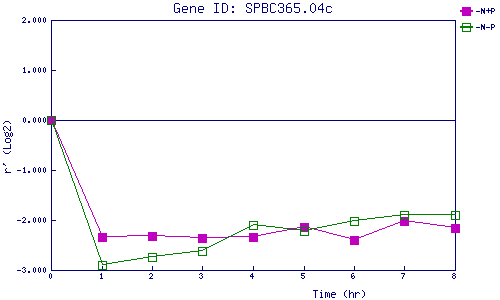
| 0 | 1 | 2 | 3 | 4 | 5 | 6 | 7 | 8 | |
| -N+P | 0.000 | -2.338 | -2.318 | -2.360 | -2.337 | -2.146 | -2.399 | -2.015 | -2.156 |
| -N-P | 0.000 | -2.895 | -2.746 | -2.613 | -2.106 | -2.229 | -2.029 | -1.903 | -1.906 |
|
-N+P: Nitrogen starved in the presence of P-factor -N-P: Nitrogen starved in the absence of P-factor |