pmt3 ubl2 smt3
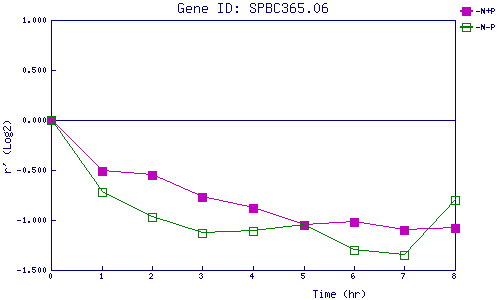
| 0 | 1 | 2 | 3 | 4 | 5 | 6 | 7 | 8 | |
| -N+P | 0.000 | -0.510 | -0.548 | -0.772 | -0.879 | -1.052 | -1.016 | -1.098 | -1.076 |
| -N-P | 0.000 | -0.716 | -0.969 | -1.128 | -1.106 | -1.047 | -1.302 | -1.350 | -0.801 |
|
-N+P: Nitrogen starved in the presence of P-factor -N-P: Nitrogen starved in the absence of P-factor |