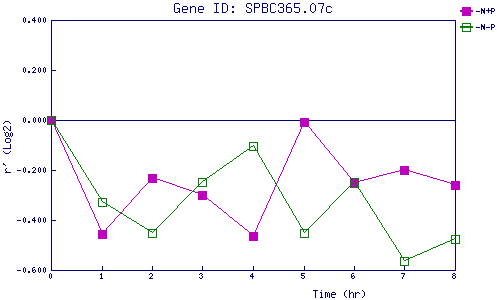
| 0 | 1 | 2 | 3 | 4 | 5 | 6 | 7 | 8 | |
| -N+P | 0.000 | -0.458 | -0.232 | -0.299 | -0.466 | -0.009 | -0.251 | -0.200 | -0.261 |
| -N-P | 0.000 | -0.326 | -0.452 | -0.247 | -0.106 | -0.452 | -0.246 | -0.565 | -0.477 |
|
-N+P: Nitrogen starved in the presence of P-factor -N-P: Nitrogen starved in the absence of P-factor |