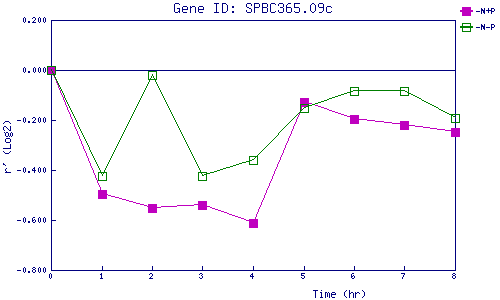
| 0 | 1 | 2 | 3 | 4 | 5 | 6 | 7 | 8 | |
| -N+P | 0.000 | -0.497 | -0.550 | -0.540 | -0.611 | -0.127 | -0.196 | -0.219 | -0.247 |
| -N-P | 0.000 | -0.425 | -0.019 | -0.426 | -0.360 | -0.152 | -0.083 | -0.085 | -0.193 |
|
-N+P: Nitrogen starved in the presence of P-factor -N-P: Nitrogen starved in the absence of P-factor |