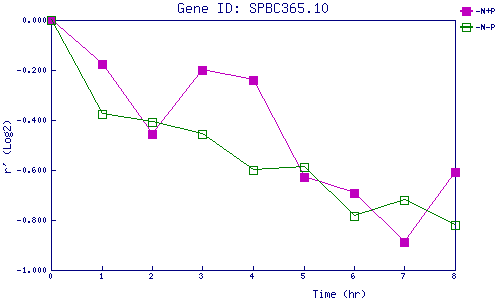
| 0 | 1 | 2 | 3 | 4 | 5 | 6 | 7 | 8 | |
| -N+P | 0.000 | -0.177 | -0.457 | -0.200 | -0.239 | -0.629 | -0.691 | -0.890 | -0.608 |
| -N-P | 0.000 | -0.375 | -0.409 | -0.457 | -0.598 | -0.589 | -0.782 | -0.722 | -0.820 |
|
-N+P: Nitrogen starved in the presence of P-factor -N-P: Nitrogen starved in the absence of P-factor |