| 0 | 1 | 2 | 3 | 4 | 5 | 6 | 7 | 8 | |
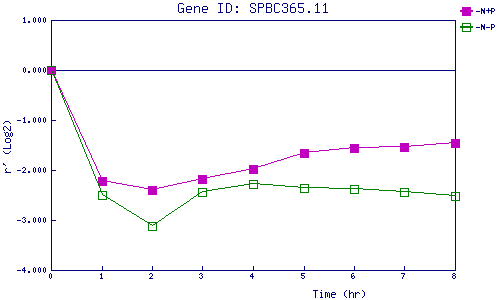
| -N+P | 0.000 | -2.224 | -2.395 | -2.185 | -1.977 | -1.666 | -1.557 | -1.537 | -1.458 |
| -N-P | 0.000 | -2.506 | -3.129 | -2.444 | -2.276 | -2.355 | -2.386 | -2.447 | -2.530 |
|
-N+P: Nitrogen starved in the presence of P-factor -N-P: Nitrogen starved in the absence of P-factor |
