hba1 caf1
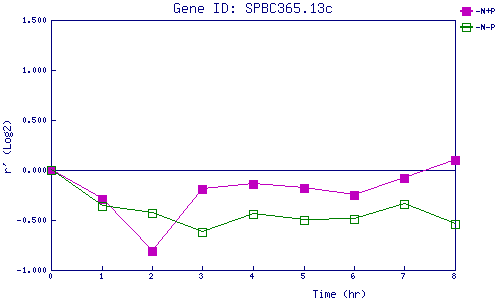
| 0 | 1 | 2 | 3 | 4 | 5 | 6 | 7 | 8 | |
| -N+P | 0.000 | -0.290 | -0.812 | -0.187 | -0.141 | -0.176 | -0.247 | -0.078 | 0.095 |
| -N-P | 0.000 | -0.360 | -0.427 | -0.616 | -0.435 | -0.504 | -0.489 | -0.338 | -0.539 |
|
-N+P: Nitrogen starved in the presence of P-factor -N-P: Nitrogen starved in the absence of P-factor |