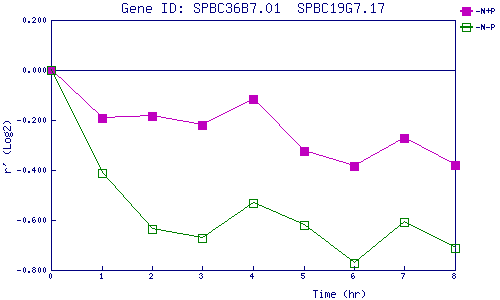
| 0 | 1 | 2 | 3 | 4 | 5 | 6 | 7 | 8 | |
| -N+P | 0.000 | -0.190 | -0.185 | -0.221 | -0.117 | -0.324 | -0.383 | -0.274 | -0.380 |
| -N-P | 0.000 | -0.411 | -0.636 | -0.673 | -0.531 | -0.620 | -0.772 | -0.609 | -0.714 |
|
-N+P: Nitrogen starved in the presence of P-factor -N-P: Nitrogen starved in the absence of P-factor |