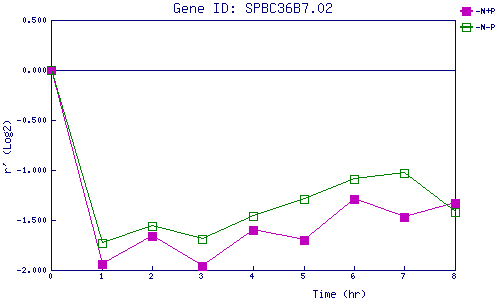
| 0 | 1 | 2 | 3 | 4 | 5 | 6 | 7 | 8 | |
| -N+P | 0.000 | -1.942 | -1.659 | -1.963 | -1.606 | -1.703 | -1.292 | -1.466 | -1.328 |
| -N-P | 0.000 | -1.731 | -1.565 | -1.691 | -1.458 | -1.291 | -1.086 | -1.033 | -1.415 |
|
-N+P: Nitrogen starved in the presence of P-factor -N-P: Nitrogen starved in the absence of P-factor |