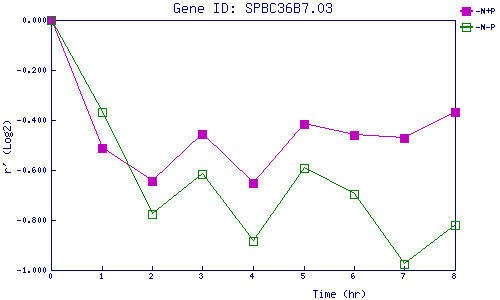
| 0 | 1 | 2 | 3 | 4 | 5 | 6 | 7 | 8 | |
| -N+P | 0.000 | -0.510 | -0.643 | -0.455 | -0.653 | -0.417 | -0.460 | -0.472 | -0.368 |
| -N-P | 0.000 | -0.366 | -0.776 | -0.614 | -0.883 | -0.590 | -0.696 | -0.975 | -0.819 |
|
-N+P: Nitrogen starved in the presence of P-factor -N-P: Nitrogen starved in the absence of P-factor |