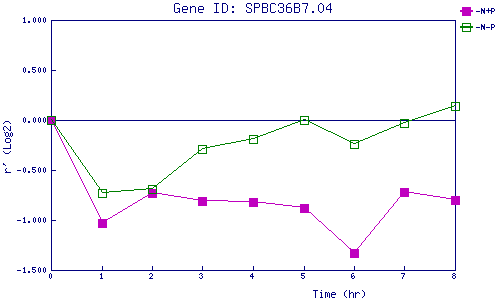
| 0 | 1 | 2 | 3 | 4 | 5 | 6 | 7 | 8 | |
| -N+P | 0.000 | -1.032 | -0.733 | -0.806 | -0.816 | -0.884 | -1.327 | -0.724 | -0.797 |
| -N-P | 0.000 | -0.727 | -0.690 | -0.294 | -0.192 | 0.001 | -0.240 | -0.030 | 0.140 |
|
-N+P: Nitrogen starved in the presence of P-factor -N-P: Nitrogen starved in the absence of P-factor |