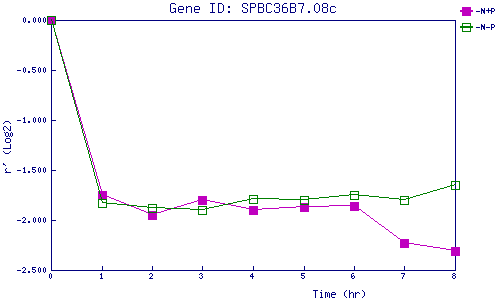
| 0 | 1 | 2 | 3 | 4 | 5 | 6 | 7 | 8 | |
| -N+P | 0.000 | -1.747 | -1.953 | -1.805 | -1.901 | -1.869 | -1.855 | -2.232 | -2.312 |
| -N-P | 0.000 | -1.826 | -1.875 | -1.901 | -1.787 | -1.801 | -1.747 | -1.798 | -1.651 |
|
-N+P: Nitrogen starved in the presence of P-factor -N-P: Nitrogen starved in the absence of P-factor |