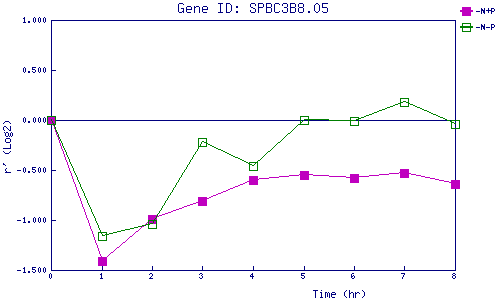
| 0 | 1 | 2 | 3 | 4 | 5 | 6 | 7 | 8 | |
| -N+P | 0.000 | -1.409 | -0.986 | -0.808 | -0.598 | -0.552 | -0.581 | -0.528 | -0.639 |
| -N-P | 0.000 | -1.161 | -1.043 | -0.224 | -0.462 | -0.005 | -0.011 | 0.180 | -0.036 |
|
-N+P: Nitrogen starved in the presence of P-factor -N-P: Nitrogen starved in the absence of P-factor |