reserved_name_dsd1 dsd1
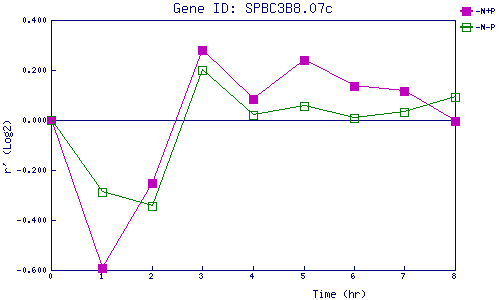
| 0 | 1 | 2 | 3 | 4 | 5 | 6 | 7 | 8 | |
| -N+P | 0.000 | -0.591 | -0.253 | 0.280 | 0.084 | 0.238 | 0.138 | 0.117 | -0.004 |
| -N-P | 0.000 | -0.289 | -0.343 | 0.199 | 0.020 | 0.058 | 0.006 | 0.034 | 0.092 |
|
-N+P: Nitrogen starved in the presence of P-factor -N-P: Nitrogen starved in the absence of P-factor |