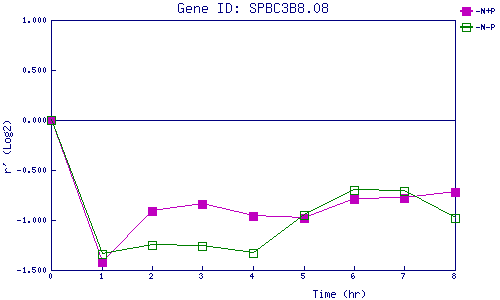
| 0 | 1 | 2 | 3 | 4 | 5 | 6 | 7 | 8 | |
| -N+P | 0.000 | -1.418 | -0.907 | -0.836 | -0.958 | -0.980 | -0.790 | -0.781 | -0.717 |
| -N-P | 0.000 | -1.336 | -1.253 | -1.260 | -1.332 | -0.948 | -0.698 | -0.709 | -0.976 |
|
-N+P: Nitrogen starved in the presence of P-factor -N-P: Nitrogen starved in the absence of P-factor |