| 0 | 1 | 2 | 3 | 4 | 5 | 6 | 7 | 8 | |
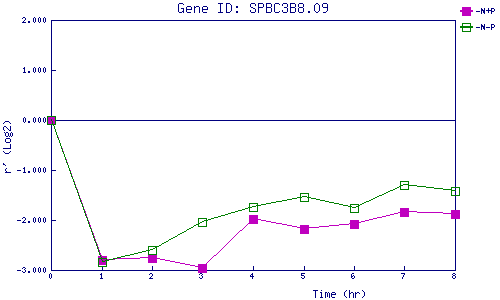
| -N+P | 0.000 | -2.796 | -2.764 | -2.966 | -1.988 | -2.185 | -2.080 | -1.846 | -1.882 |
| -N-P | 0.000 | -2.845 | -2.603 | -2.045 | -1.736 | -1.538 | -1.761 | -1.295 | -1.416 |
|
-N+P: Nitrogen starved in the presence of P-factor -N-P: Nitrogen starved in the absence of P-factor |
