| 0 | 1 | 2 | 3 | 4 | 5 | 6 | 7 | 8 | |
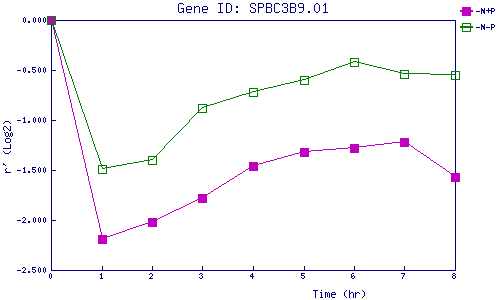
| -N+P | 0.000 | -2.187 | -2.018 | -1.781 | -1.460 | -1.322 | -1.278 | -1.225 | -1.571 |
| -N-P | 0.000 | -1.490 | -1.397 | -0.885 | -0.718 | -0.605 | -0.424 | -0.537 | -0.547 |
|
-N+P: Nitrogen starved in the presence of P-factor -N-P: Nitrogen starved in the absence of P-factor |