cwf28
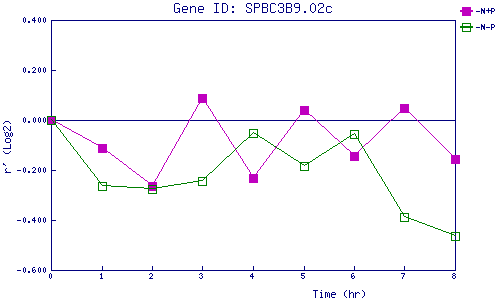
| 0 | 1 | 2 | 3 | 4 | 5 | 6 | 7 | 8 | |
| -N+P | 0.000 | -0.110 | -0.262 | 0.090 | -0.231 | 0.041 | -0.142 | 0.050 | -0.157 |
| -N-P | 0.000 | -0.264 | -0.275 | -0.244 | -0.052 | -0.185 | -0.058 | -0.388 | -0.465 |
|
-N+P: Nitrogen starved in the presence of P-factor -N-P: Nitrogen starved in the absence of P-factor |