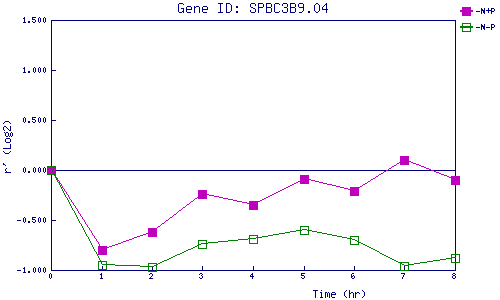
| 0 | 1 | 2 | 3 | 4 | 5 | 6 | 7 | 8 | |
| -N+P | 0.000 | -0.798 | -0.618 | -0.245 | -0.348 | -0.090 | -0.206 | 0.103 | -0.100 |
| -N-P | 0.000 | -0.952 | -0.970 | -0.743 | -0.689 | -0.604 | -0.703 | -0.955 | -0.877 |
|
-N+P: Nitrogen starved in the presence of P-factor -N-P: Nitrogen starved in the absence of P-factor |