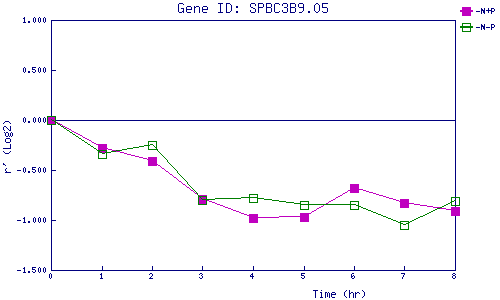
| 0 | 1 | 2 | 3 | 4 | 5 | 6 | 7 | 8 | |
| -N+P | 0.000 | -0.285 | -0.407 | -0.790 | -0.975 | -0.969 | -0.684 | -0.834 | -0.911 |
| -N-P | 0.000 | -0.341 | -0.251 | -0.801 | -0.780 | -0.853 | -0.851 | -1.052 | -0.806 |
|
-N+P: Nitrogen starved in the presence of P-factor -N-P: Nitrogen starved in the absence of P-factor |