rpa43 rpa21
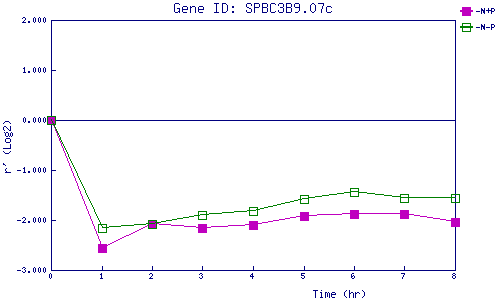
| 0 | 1 | 2 | 3 | 4 | 5 | 6 | 7 | 8 | |
| -N+P | 0.000 | -2.554 | -2.089 | -2.164 | -2.106 | -1.916 | -1.881 | -1.887 | -2.034 |
| -N-P | 0.000 | -2.151 | -2.084 | -1.897 | -1.826 | -1.579 | -1.445 | -1.558 | -1.553 |
|
-N+P: Nitrogen starved in the presence of P-factor -N-P: Nitrogen starved in the absence of P-factor |