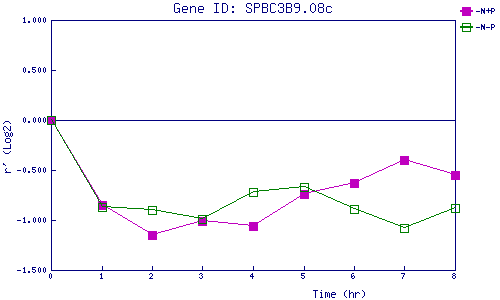
| 0 | 1 | 2 | 3 | 4 | 5 | 6 | 7 | 8 | |
| -N+P | 0.000 | -0.847 | -1.149 | -1.013 | -1.064 | -0.741 | -0.629 | -0.402 | -0.549 |
| -N-P | 0.000 | -0.872 | -0.903 | -0.989 | -0.718 | -0.670 | -0.887 | -1.077 | -0.881 |
|
-N+P: Nitrogen starved in the presence of P-factor -N-P: Nitrogen starved in the absence of P-factor |